
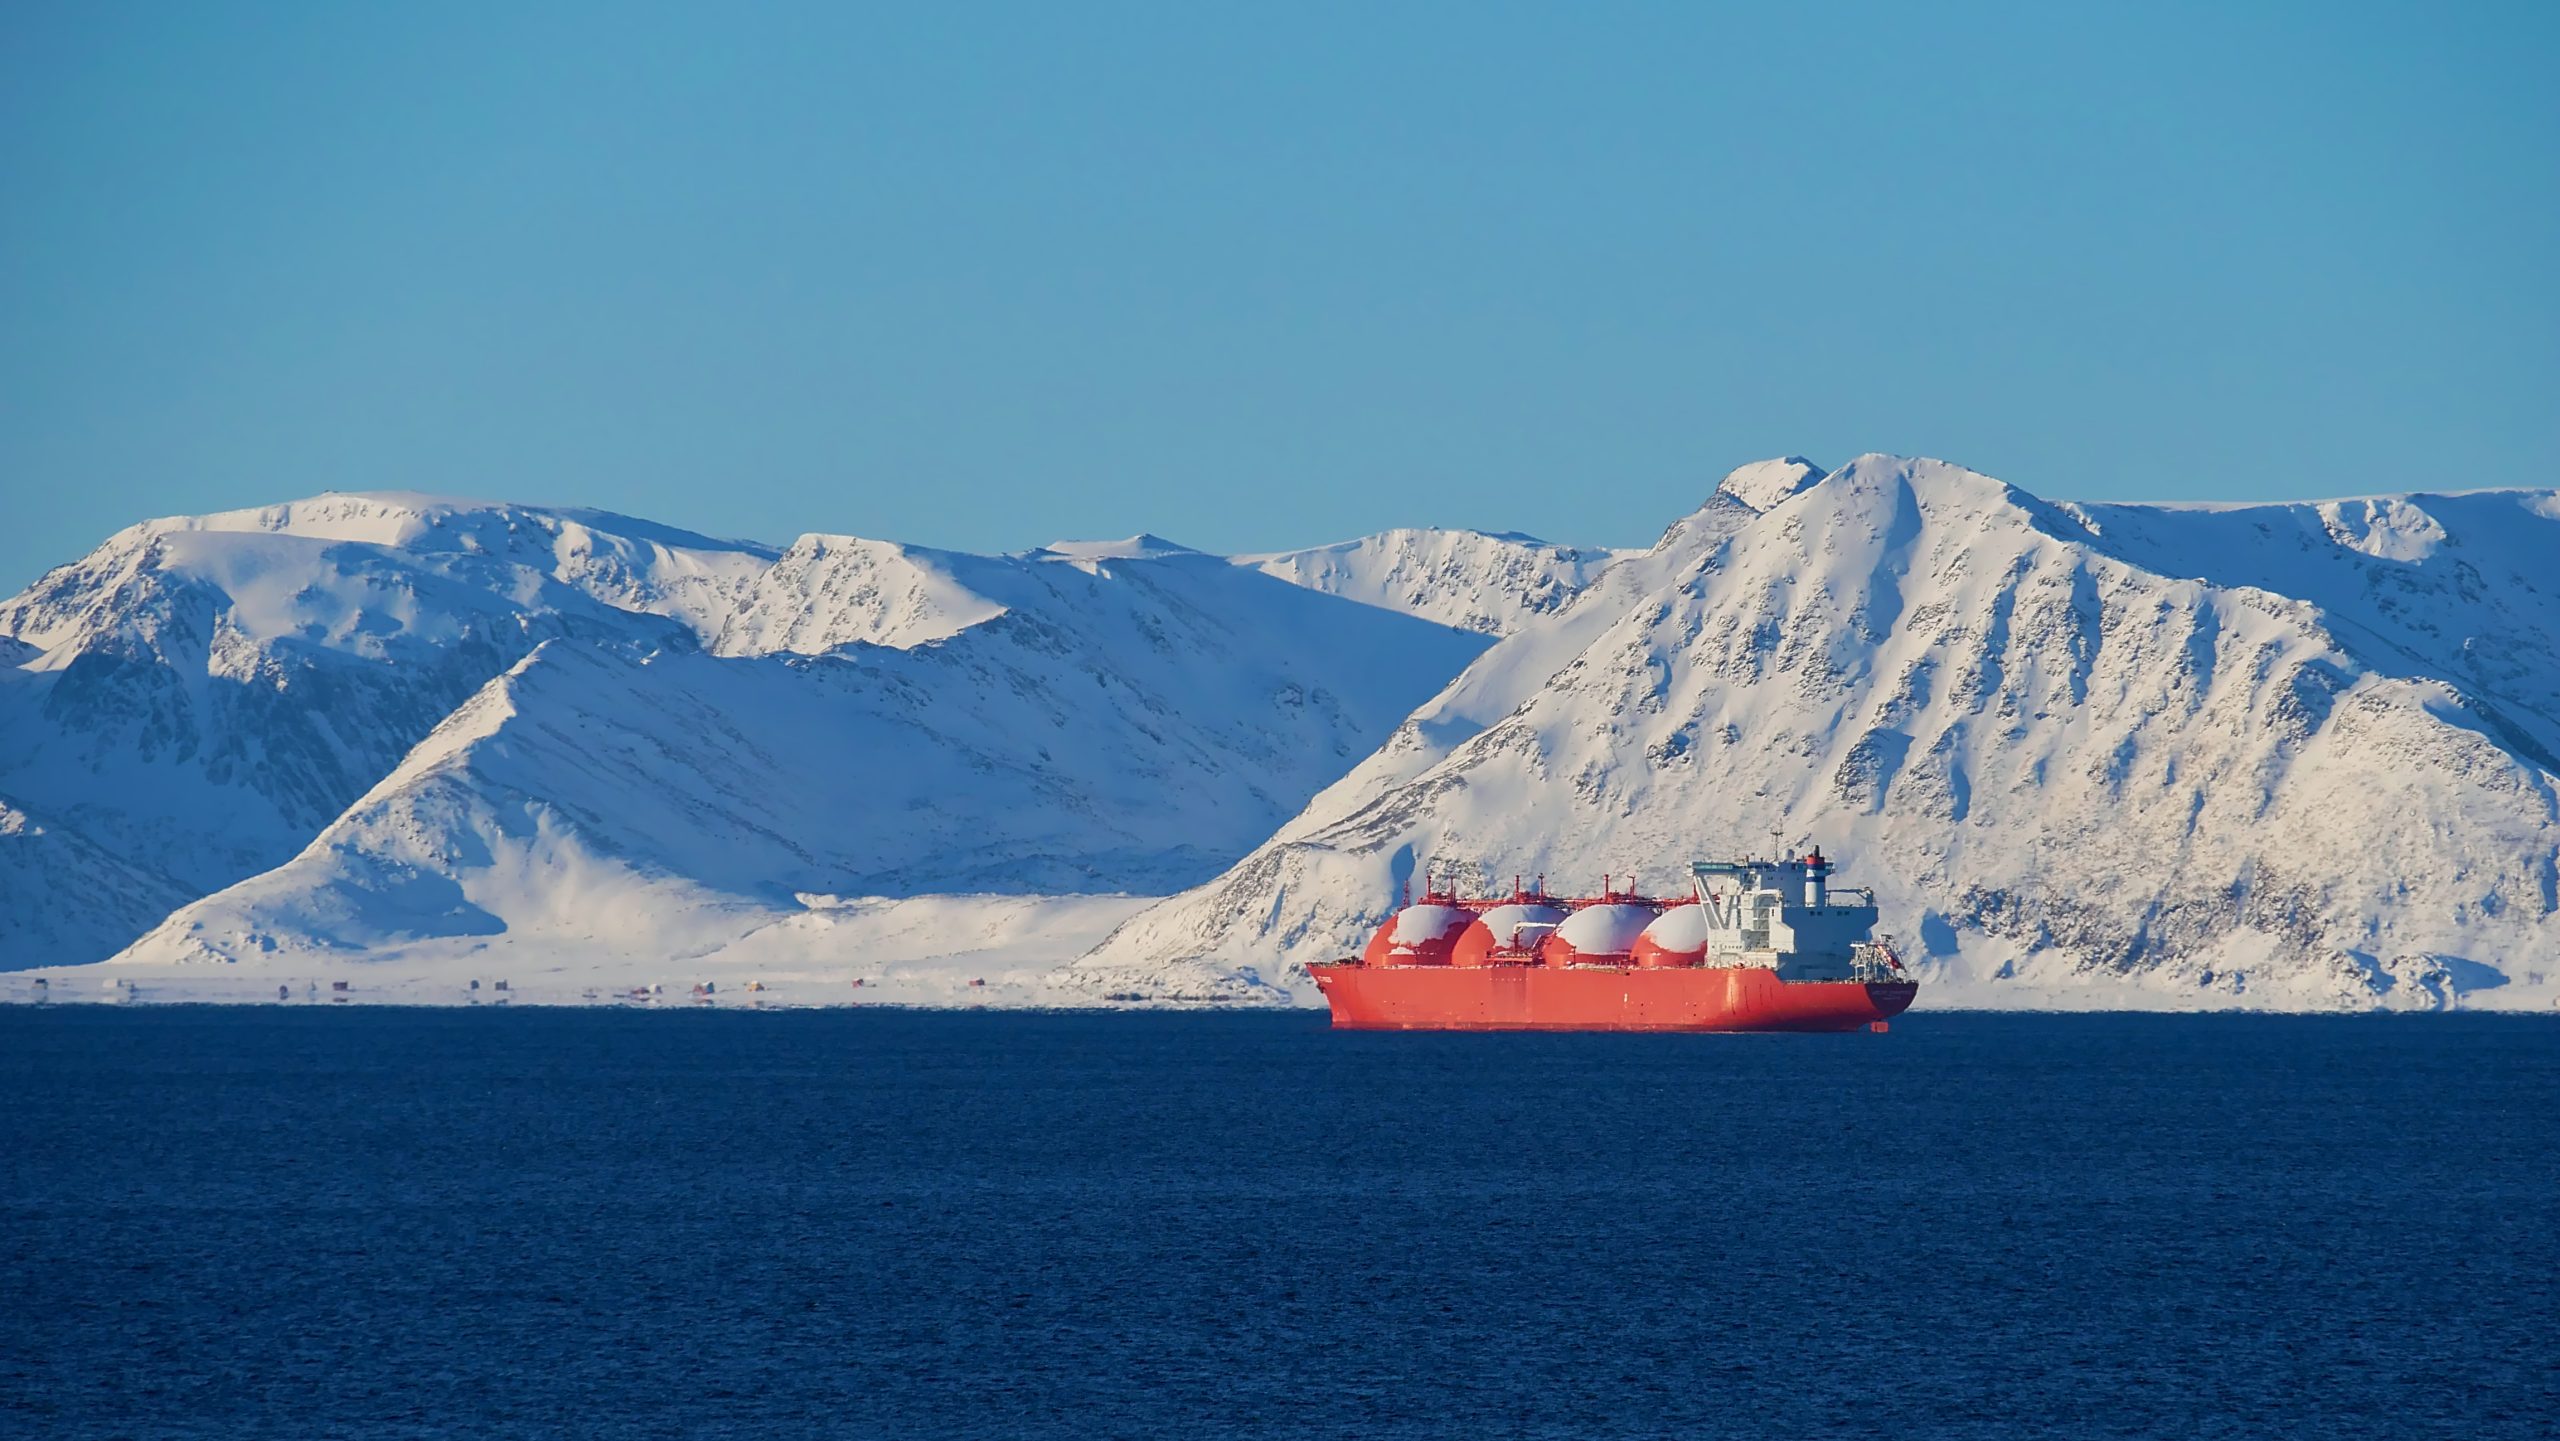
Shell’s LNG portfolio is bigger than most investors realize, as demonstrated by recently reported operational metrics that reveal the true scale of the energy major’s liquefied natural gas activities. When evaluating integrated oil and gas enterprises, market participants frequently focus on headline production figures or crude oil metrics while overlooking the massive midstream and trading operations that drive global energy flows. Shell Plc (NYSE: SHEL) operates a sprawling global network spanning production, liquefaction, shipping, trading, and regasification. By examining the actual volume numbers reported for mid-2026, analysts and investors can better gauge the true magnitude of the company’s position in the international gas trade.
What Changed
During the second quarter of 2026, Shell sold 17.96 million metric tons of liquefied natural gas. On an annualized basis, this quarterly volume equates to nearly 72 million metric tons. To put these figures into perspective, Shell’s own direct LNG liquefaction volumes stood at 7.7 million metric tons during Q2 2026. The substantial gap between its owned liquefaction output and its total sales highlights the vital role of the company’s trading operation, which actively buys LNG from partners and third parties before moving it across global markets.
Context and Portfolio Scale
Understanding Shell’s market position requires looking beyond a single quarter of sales. The company currently maintains roughly 44 million metric tons of annual equity LNG capacity. Beyond production and equity assets, Shell operates an extensive LNG shipping business with a proprietary or controlled fleet representing roughly 10% of the global market.
The broader market backdrop demonstrates substantial global scale. Global LNG trade reached roughly 422 million metric tons in 2025. Shell’s quarterly run rate positions it as a dominant force within this multi-hundred-million-ton market. The corporation’s operational footprint encompasses the entire value chain, bridging upstream extraction fields with downstream regasification terminals through sophisticated maritime logistics and trading desks.
Business Implications and Market Position
Shell Plc (NYSE: SHEL) trades with a market capitalization of $275 billion, a current share price of $96.23, and a day’s range of $94.97 to $96.38. Its 52-week trading range spans from $68.63 to $99.16, accompanied by a gross margin of 18.12% and a dividend yield of 3.14%. (Note: Market cap figures may vary due to calculations using publicly traded shares outstanding only, excluding unlisted, private, or dual-class non-traded shares.)
The ability to source volumes beyond its own 7.7 million metric tons of quarterly liquefaction output demonstrates the strength of Shell’s trading arm. By leveraging its 10% global market share in shipping and its extensive trading contracts, the company captures value from price arbitrage, regional supply imbalances, and long-term supply security agreements across Europe, Asia, and the Americas.
Sector Impact and Future Growth Outlook
Looking toward long-term horizons, industry demand projections suggest substantial expansion for the sector. Shell expects global LNG demand to climb to nearly 700 million metric tons annually by 2050. To meet this anticipated trajectory, supply infrastructure must evolve. Approximately 180 million metric tons of new annual LNG supply is expected to come online globally by 2030.
Given its established equity capacity of 44 million metric tons and its massive trading infrastructure, Shell should be well positioned to participate in future LNG growth. As new liquefaction projects approach completion ahead of 2030, the company’s integrated shipping and regasification capabilities provide ready channels to absorb and monetize additional volumes.
Limitations and Risks
Despite the impressive volume figures, investors must account for inherent market risks in the global energy sector. Commodity price volatility, geopolitical shifts affecting maritime shipping lanes, regulatory changes regarding emissions, and the capital-intensive nature of upstream and midstream infrastructure all present continuous variables. Furthermore, while trading operations amplify revenue potential during periods of market dislocation, they also introduce complex risk management and exposure challenges.
What to Watch Next
As the energy transition progresses toward 2030 and 2050 targets, market observers should monitor upcoming quarterly reports for shifts in equity liquefaction volumes versus third-party trading purchases. Tracking the deployment of the 180 million metric tons of expected global supply additions will also clarify how effectively Shell maintains its approximately 10% shipping footprint and its dominant sales velocity in an expanding international market.